Dejan SEO team is working on link graph visualisation methodology in order to develop link and social network analysis framework aimed to solve risk assessment challenges, influence calculation and social graph analysis.
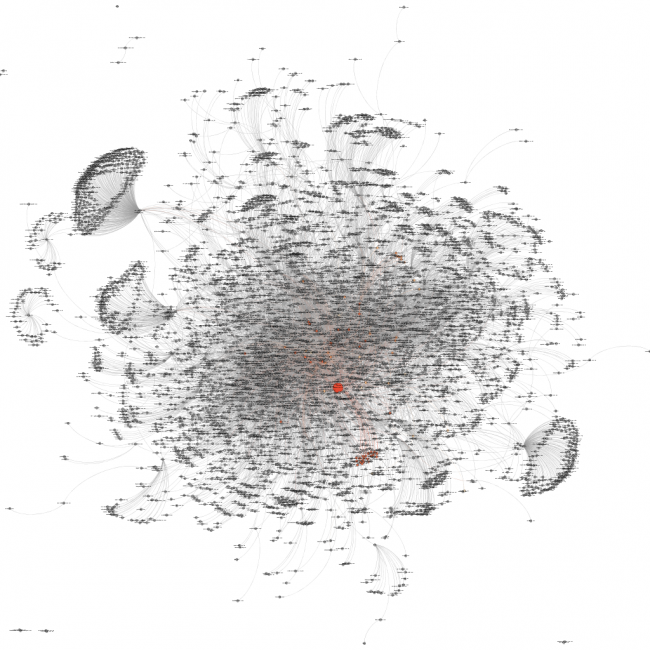
The big bright dot is Dejan SEO, scaling down in colour intensity with each next link connection. Observe the small groups of interlinked websites – this is one way search engines can determine how one website related to another and also use for link spam detection.
The first step in link graph visualisation is of course data retrieval using custom crawling with strict parameter limiting. The output file produces a large but simple CSV with link source, link target, linking domain, linked domain and anchor text. No other metrics are used at this point in time, however we are considering applying MozRank or PageRank by scaling the size of each node on the graph. Additional visualisation aid with extra parameters could be achieved through edge (link) colouring influenced by the number of outbound links on the page.
The above graph was produced by partial and combined Force Atlas 2 and Yifan Hu transformation with manual node colouring and colour-flow to outbound links.
Dan Petrovic, the managing director of DEJAN, is Australia’s best-known name in the field of search engine optimisation. Dan is a web author, innovator and a highly regarded search industry event speaker.
ORCID iD: https://orcid.org/0000-0002-6886-3211

